
A commonly asked question is: What is Superficial Velocity and when do I use it?
If a fluid flows through a region that is occupied by either fixed structures (a porous region, pipe rack, catalyst bed, etc...), or shares the channel with other fluids (e.g. gas-liquid flow), there are two ways to describe the fluid velocity.
The first is to use the "True Velocity" which is the actual velocity of the fluid particles. This velocity will vary with location in the porous matrix. This is the velocity you would measure experimentally if you focused on a small region of fluid.
The second is the "Superficial Velocity", which is the velocity the fluid would have if it were flowing through the same domain without any obstructions. This is a very useful quantity as in incompressible flow it is conserved regardless of the variation of the porosity. Therefore, even at a boundary between a porous region and continuous fluid the superficial velocity is unchanged, whereas the true velocity must increase in the porous region so that mass is conserved.
These two velocities are easily related via ![]() , where Vs is the superficial velocity, Vtrue is the true velocity and ε is the porosity (the local fraction of the volume occupied by the fluid).
, where Vs is the superficial velocity, Vtrue is the true velocity and ε is the porosity (the local fraction of the volume occupied by the fluid).
If you study multiphase flows you will certainly encounter superficial velocity as it is used to characterise a flow system. Using superficial velocity has the benefit that it is conserved (for an incompressible flow with no phase change) regardless of the complexity of the flow regime, e.g. if the flow regime changes from bubbly to slug flow, the superficial velocity stays constant even though the local velocity varies. Maps plotting the gas superficial velocity on one axis and liquid superficial velocity on the other are known as regime maps and are used to define the boundary between different regimes. When visualising the results of multiphase flow simulations, ANSYS CFD-Post will automatically give the user the choice of plotting either Superficial Velocity or (True) Velocity variables.
The use of a superficial velocity is also often encountered when dealing with pressure drop correlations for porous regions, be it a true porosity or a porosity used to represent flow obstructions. An experimentalist can use either superficial or true velocities to characterise their system, but when reviewing experimental data it is worth knowing that it is more common to use superficial velocity as this can be measured outside of the porous region.
Consider Darcy's law for slow flow (negligible inertia) in a porous medium, which relates the volumetric flow through a given face to the pressure drop via ![]() where q is the volumetric flowrate, κ is the permeability, μ is the dynamic viscosity and p is the pressure. Here q can be replaced by the flow area multiplied by the superficial velocity, so that the above equation becomes:
where q is the volumetric flowrate, κ is the permeability, μ is the dynamic viscosity and p is the pressure. Here q can be replaced by the flow area multiplied by the superficial velocity, so that the above equation becomes: ![]() where now v must be the superficial velocity.
where now v must be the superficial velocity.
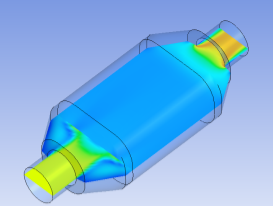
To help demonstrate the difference between superficial velocity and true velocity in a CFD model with a porous domain, let’s look at the flow through a catalytic converter. A porous domain is used to represent the ceramic monolith substrate. Exhaust gas flows through the inlet, passes through an expansion which leads to the porous domain, and then flows through a contraction and the outlet. The substrate is impermeable in the X and Y direction, and the loss in the Z-direction is represented by specifying the volume porosity and higher order loss coefficients.

When post-processing the model in CFD-Post, we can visualize the pressure drop due to the substrate by inserting a two-dimensional plane, or similarly, using a chart.

The pressure drop due to the porous domain is quite evident using both visualization techniques. We can use the same technique to plot the flow velocity:

It is evident that a jump in the plotted velocity occurs within the porous domain. This is because the velocity visualised by CFD-Post is the actual or true velocity, and due to the porous obstructions the flow will speed up within the porous region. To plot the representative or superficial velocity of the flow through the substrate, we can create a User Defined Variable in CFD-Post which references an expression of velocity multiplied by area porosity (or equivalently the volume porosity in an isotropic material), as follows:
Insert an expression by clicking the Expressions Tab in CFD-Post and naming the expression appropriately. Set the value as Velocity*Volume Porosity for an isotropic model. Then insert a new variable by clicking the Variables Tab, Insert New Variable and reference your previous expression.

We can now plot Superficial Velocity as a flow variable on our central plane and in a line chart (as below) and, as you would expect, we no longer observe any discontinuity at the porous domain boundaries.

We hope that this post has helped clear up some common misconceptions about the use of superficial and true velocities in CFD simulations. Please let us know in the comments below if this has helped you with your CFD model, or if you have any further questions.


