
As mentioned in the accompanying blog post, being able to predict material degradation in transfer chutes is very important mainly for two reasons, namely, to reduce the environmental impact of dust created by fine particles and in some cases to maintain quality of the material. Until now, these sorts of problems have received very little attention in DEM because of their complexity. But with the Rocky breakage model, these problems now be simulated and better understood.
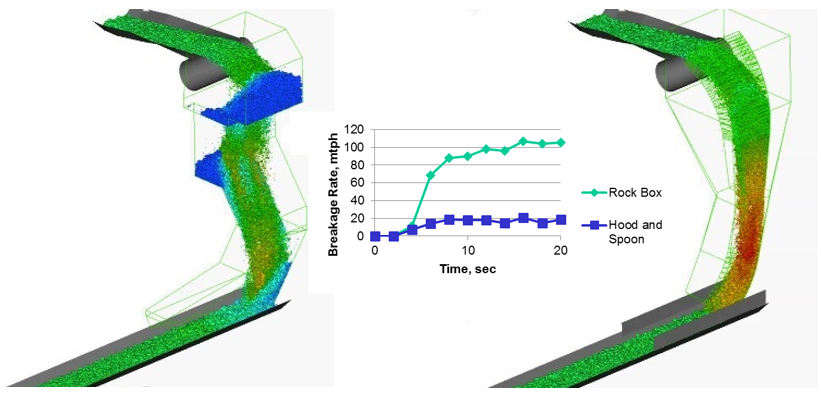
Figure 4: Geometries of two transfer chutes used in the simulation: rock box (left) and hood and spoon (right). Particles are coloured by velocity. Graph shows relative breakage rate.
The breakage model was used to simulate the flow of coal through two different transfer chutes, namely, a classic rock-box and hood and spoon configuration as shown above. Apart from chute geometry, all simulation parameters were kept the same. The simulation consisted of over one million particles, half of which were non-round and breakable and the other half round and non-breakable. The breakage properties for coal were determined via drop weight tests at different heights on an impact plate. Despite the higher particle velocities, the hood and spoon configuration endured much less breakage compared to the rock box chute as shown by the plot of breakage rate.
Another application where the accuracy of breakage model in Rocky was validated is presented below. High Pressure Grinding Roll (HPGR) are devices that are typically used in the mining and minerals industry. The HPGR is a displacement device, therefore it is expected that the results for force and power draw will depend on particle stiffness. In light of this, the particle stiffness was calibrated with respect to specific force. For the purpose of these simulations, the roll gap was fixed and particle stiffness was varied until the predicted and measured values of the force were in close agreement, the results are presented below.
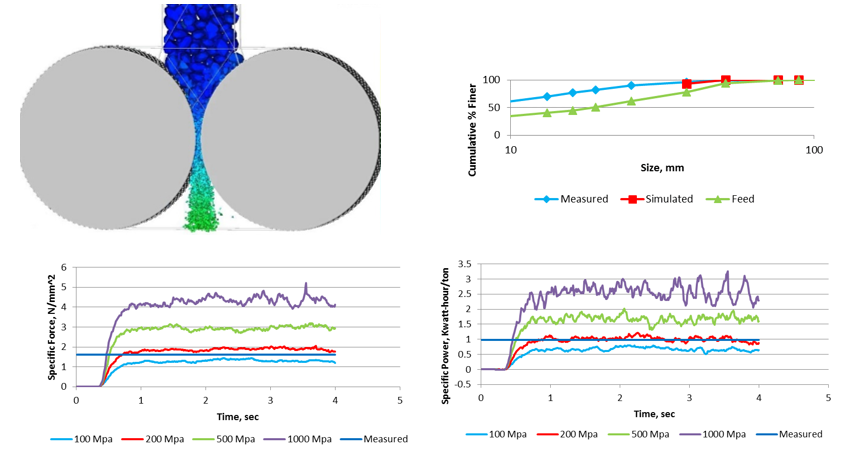
Figure 5: DEM simulation of a HPGR (top left). Results showing particle PSD after breakage (top right), specific force (bottom left) and specific power (bottom right)
As can be seen in the plot of specific force, a value of 200 MPa for the particle stiffness correlates very well to experimentally measured values. Similarly, the specific power for the same particle stiffness is also in close agreement to experimental results. This also confirms that unlike other applications with much lower consolidation forces (for example transfer chutes and conveyors) the correct stiffness value plays an important role in obtaining correct quantitative results for force and power draw. This means that the default value of 100 MPa in Rocky is normally conservative for cases that do not involve breakage or high contact forces.
The PSD obtained after breakage further confirms the accuracy of the breakage model. In the interests of computational time, the PSD was limited to four discrete groups, however this was still in good agreement with the experimentally measured values. Finally, it is important to note that whilst breakage modelling can increase the accuracy of your predictions, the computational power to process these simulations can be substantially higher - although can be addressed by taking advantage of GPU processing to reduce the solve time or time-to-solution.


