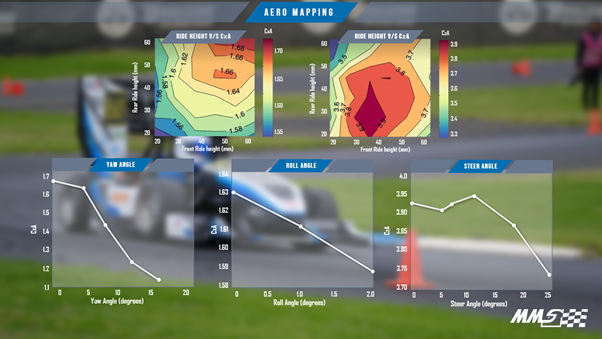
Figure: M19 Aero Map, showing ride height, yaw, steer and roll sensitivities
Formula Student is a worldwide engineering competition, tasking students to design, manufacture, test and race a small, open wheel formula style race car.
Monash Motorsport has a rich history with aerodynamics, being the first in Australia and among the first in the world to implement effective aerodynamics packages in the competition. Since the first winged car emerged in 2001, the team has been designing Formula Student cars with wings and diffusers ever since. In recent years, this has been made much more efficient and effective through greater automation of our Ansys CFD simulations, in consultation with LEAP Australia. This has allowed MMS to gather more simulation data points to generate a comprehensive aero map and gain a better understanding of the aerodynamic impacts of changes in vehicle roll, yaw, steer and ride height.
The importance of aerodynamics in cornering
Downforce plays an important role in the cornering performance of a racecar. While it is important to understand that downforce changes with speed, it is also critical to understand the way in which the downforce potential of the car changes as it moves around the track. Across a lap, the vehicle will experience changes in attitude as a result of load transfer due to braking, cornering and acceleration. These changes in ride height, roll, yaw and steer affect the aerodynamic performance and overall downforce the car is producing. Thus, the cornering potential changes depending on the car’s ‘vehicle attitude’. If these changes and their relationship with downforce are not well understood, the grip available to the driver can vary significantly throughout the duration of each corner, making the handling characteristics of the car hard for the driver to predict.
However, this requirement for aero mapping also makes the design of the aero package much more complicated. This is because designers have to work to improve the aerodynamic performance of the car across a variety of vehicle attitudes, not just for one scenario in isolation.
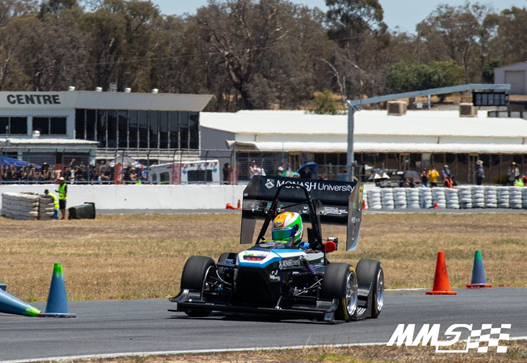
Figure: M19-C experienced a wide range of cornering attitudes at FSAE-Australasia 2019
Addressing the attitude sensitivity problem
One solution that partially addresses these issues is running an unsprung aerodynamic package, in which the aerodynamic devices can move independently of the vehicle body and maintain their designed position with respect to the ground. The team has used unsprung wings in the past, however a significant tightening of the rules and regulations surrounding the deflection of wings has made these packages much more difficult to implement. Furthermore, an unsprung aero package does not alleviate the sensitivity of the package to steer and yaw/crosswinds. So, regardless of whether the package is sprung or unsprung, conducting sensitivity analysis (aero mapping) is still vital.
One common method to achieve a proper understanding of these relationships is through aerodynamic mapping. An aero map shows the changes in a performance metric such as CLA, CDA and aero balance as a function of the car attitude parameters such as yaw, steer, roll and pitch.
For example, ground effect devices like diffusers and front wings are particularly sensitive to changes in ride height and steer. Analyzing the effect of vehicle pitch on downforce would require an aero map showing the CLA for given ride height values at the front and rear of the car. Similarly, one could create plots which would highlight trends from the effect of varying the degree of roll, yaw and steer on a specific metric.
Using a variety of the car’s on board sensors, we can determine or estimate the range of front and rear ride heights, yaw, steer and roll angles (vehicle attitudes) our cars are likely to experience and from this, gain an understanding of the physical limits we should aim to constrain our aero mapping to in simulation.
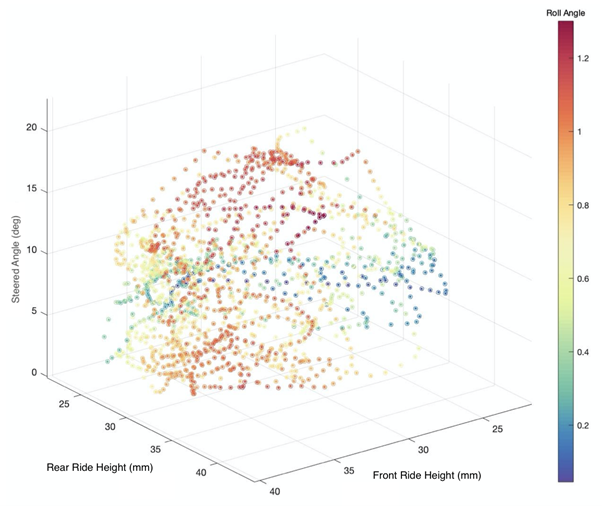
Figure: Range of car attitudes experienced across a lap of FSG
Using this data, we carry out a baseline CFD run at a certain attitude which is most ‘important’ to get right aerodynamically. This importance is determined by taking the product of the attitude’s frequency on track, as well as a measure for how much lap time is reduced by utilising downforce in that attitude. This also becomes the team’s dominant design case in CFD.
Fluent Setup
Our aero CAD model is imported into Ansys Fluent, and geometric objects such as rotating wheels, sprung and unsprung objects are defined using Fluent scripting. Attitude transformations then allow parameters such as yaw, steer, pitch and roll to be applied to the vehicle body. Using Fluent’s scripting capabilities, a simple Python script can be created which defines the range of values for each parameter to be included in the map. Once the setup is complete, Fluent meshing is used to efficiently discretise the fluid domain around the car.
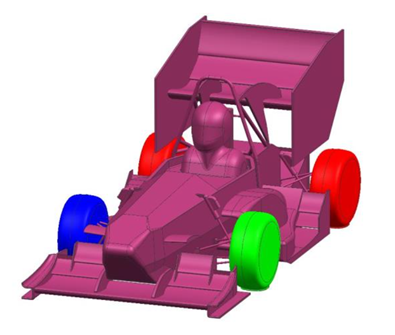
Figure: Visualisation of different setup requirements for rotating, but non-steered wheels (red), rotating and steered wheels (blue, green) and sprung components (magenta).
Fluent Meshing
Fluent’s wrapping and poly-hexcore meshing features accelerate the meshing process and allow for more robust and efficient solving. This makes it the perfect platform for completing an otherwise computationally intensive Aero Map in an acceptable time frame.
Once all of the geometry objects have been translated into their respective positions, the fluid volume and refinement zones are created and sizing settings applied. These settings are defined based on the object ‘type’, which both standardize the mesh settings for automation and allow flexibility in the mesh density in different regions around the car, further improving efficiency. For example, the front wing requires a finer mesh and greater number of inflation layers than the chassis does and so they have different mesh specifications. Once the sizing has been applied, the surfaces are wrapped. This involves extracting the edges and creating intersection loops so that if some of the parts are intersecting each other significantly, which is necessary when modelling the suspension movement, a watertight surface mesh can still be created.
Once wrapping and mesh quality improvement is undertaken to collapse high skewness elements, the script creates the volume mesh with poly hexcore elements and inflation is applied. The poly elements follow the geometry, capturing complex surfaces, while hex elements fill the remainder of the virtual wind tunnel volume more efficiently and help cut down overall run time.
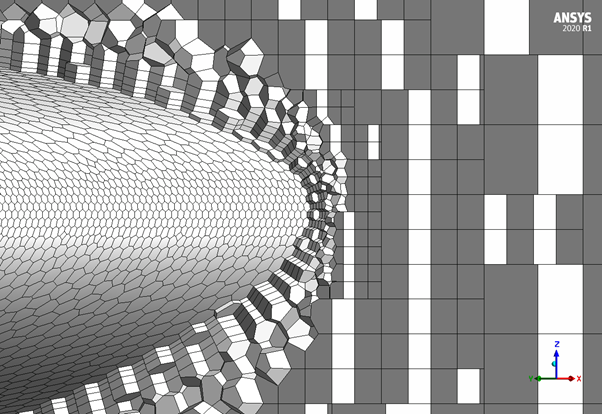
Figure: Fluent poly-hexcore meshing of an aerofoil
Fluent Solving
Once meshing is complete, the solution methods are set up, including the boundary conditions and most notable for our use, the solver. Hybrid initialisation is utilised to accelerate convergence times while also reducing the occurrence of solution instabilities in the first few iterations. Fluent’s Pressure Coupled Pseudo Transient Solver is chosen as it significantly reduces the number of iterations required to reach convergence. This approach does use more memory than the segregated solver, however with the team’s access to the MonARCH Cluster and their high RAM computing nodes, the time saved is more valuable to the team than reducing memory requirements.
MMS uses the k-epsilon realizable turbulence model with enhanced wall treatment for CFD simulations as it can provide an approximation of the boundary layer flow with larger y+ values than other models. This allows for reasonable results with less mesh density, further reducing the solve times.
Analysing the results
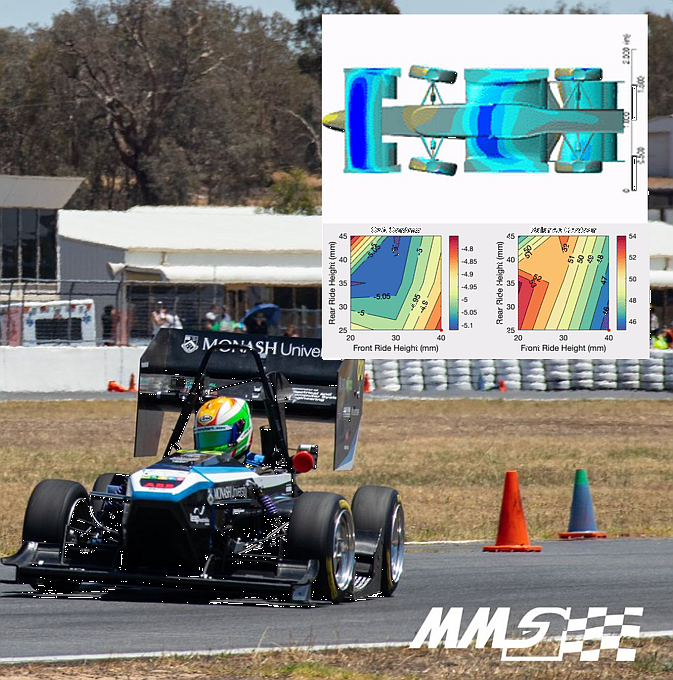
After the simulations have completed, the results can be collated and visualised in a number of different ways. Front and rear ride height data points from either testing or simulation are overlaid onto CLA contours to gain an understanding of the car’s operating range with respect to the simulated map. We can visualise the expected ride height range across a lap and make changes to suspension design in order to shift this operating range into more desirable bounds. This is an important design feedback loop to have, since the geometry and aerodynamic design can be balanced allowing optimisation of the overall package, rather than optimising suspension and aerodynamics in isolation.
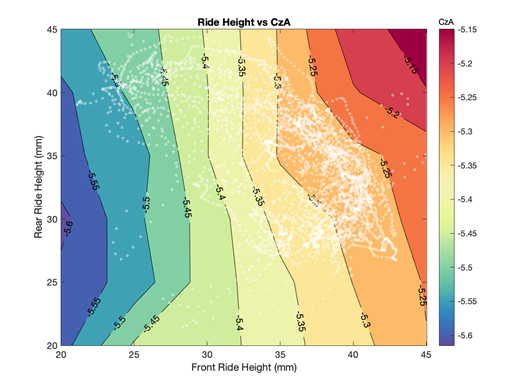
Figure: Track data (white) overlaid on ride height contours of CLA
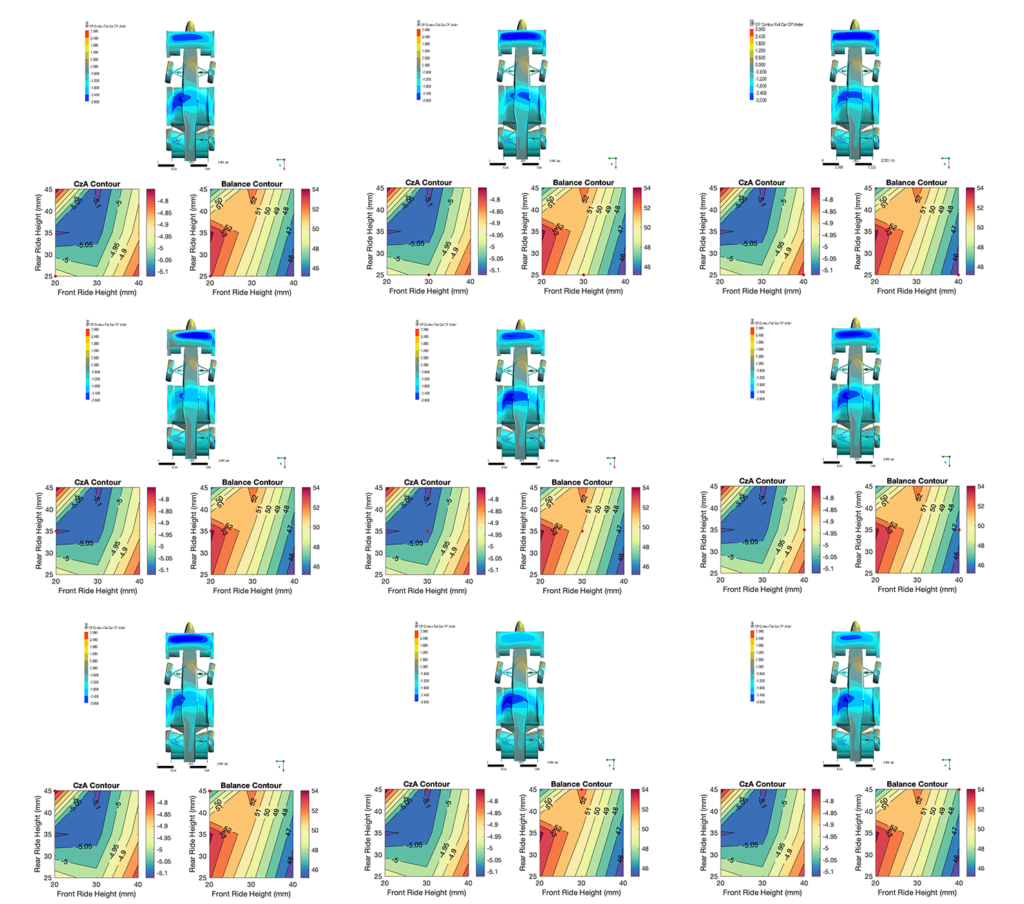
Additionally, using CFD-Post, visualisations such as CP contours can be generated for each attitude within the map. Combining this with sensitivity plots provides a useful tool for our aerodynamic designers, enabling design flaws or areas of high sensitivity to be readily identified, understood and remedied.
Figure: Combining CFD-Post contours with sensitivity plots (Note: Animated GIF - watch closely to observe changes!)
Correlation
CFD models are idealisations of real world situations and the predicted flow structures may vary compared to on-track conditions. To understand any inaccuracies in CFD simulations, it is also important to complete physical testing. During testing, pressure taps are used to understand how pressures are changing at different points across the package, which are then correlated to CFD. Currently we are looking at how this pressure tapping data could be used to refine the aero maps for our cars and see if there are particular sensitivity trends or extremities of vehicle attitudes that are not being modelled well.
Using Aero maps not only helps us understand the downforce and drag sensitivity of our aero packages for various parameters, but also enables us to visualize aero balance across the attitude range. It ensures that our aero platform is stable across a range of vehicle attitudes and helps us in driving suspension design decisions. Thus, instead of chasing aerodynamic target metrics in straight-line, by including aero mapping in the design process we ensure consistent and reliable performance across the lap. This gives our drivers more consistent and predictable grip and thus greater confidence, improving lap time and potential for points.

Figure: M19-C Front wing pressure tapping data
The foundations of this work were developed by Paul Hendy in his final year thesis ‘Aero Map for Formula Student’. A detailed study of aero mapping can be found in his Final Year Thesis.