
ECU-R (Edith Cowan University Racing) has been designing and manufacturing its first ever EV (Electric Vehicle) for Formula Student - a global engineering competition focused on the development of high-performance open wheel race cars. Competition is fierce and producing a competitive car requires teamwork, high-quality design, extensive manufacturing, and project management. This blog will focus on how ECU-R uses simulation to ‘drive’ design within the aerodynamics department.
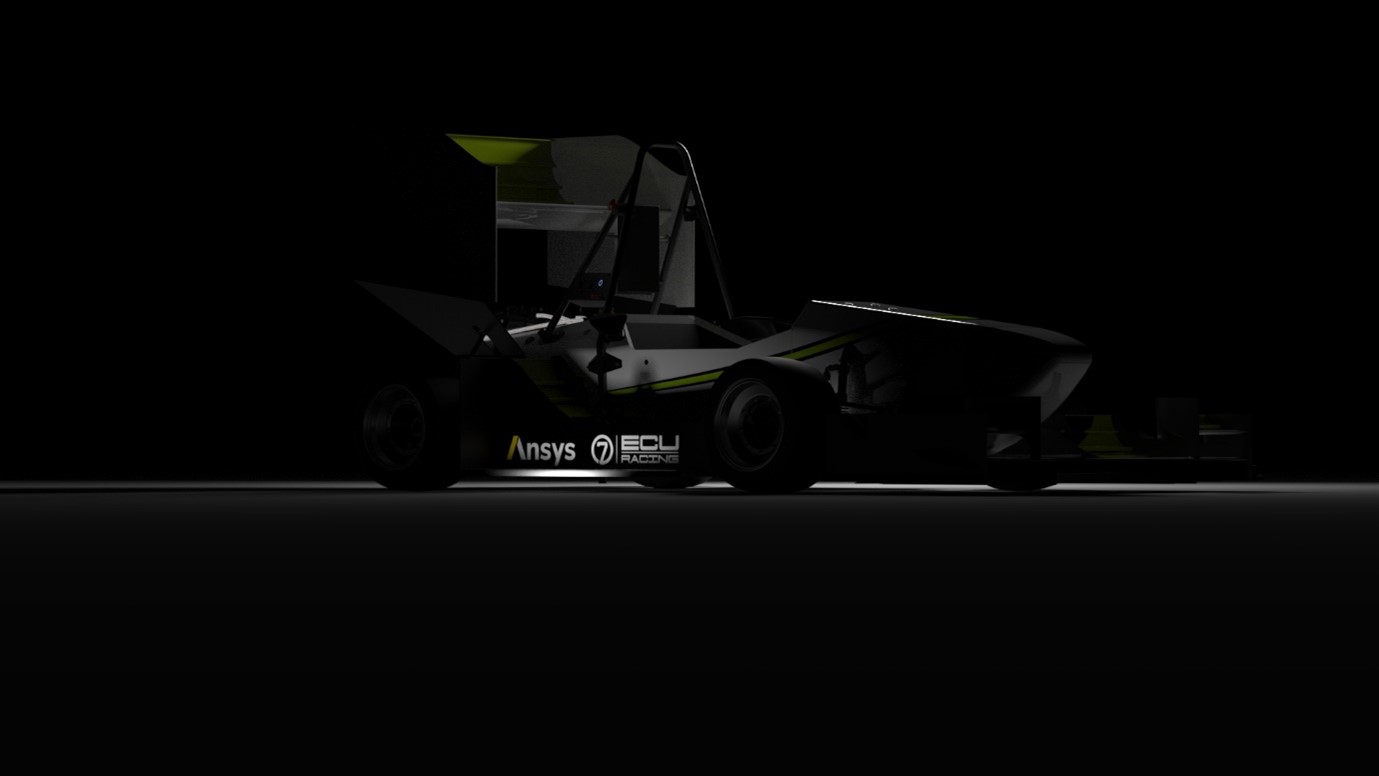
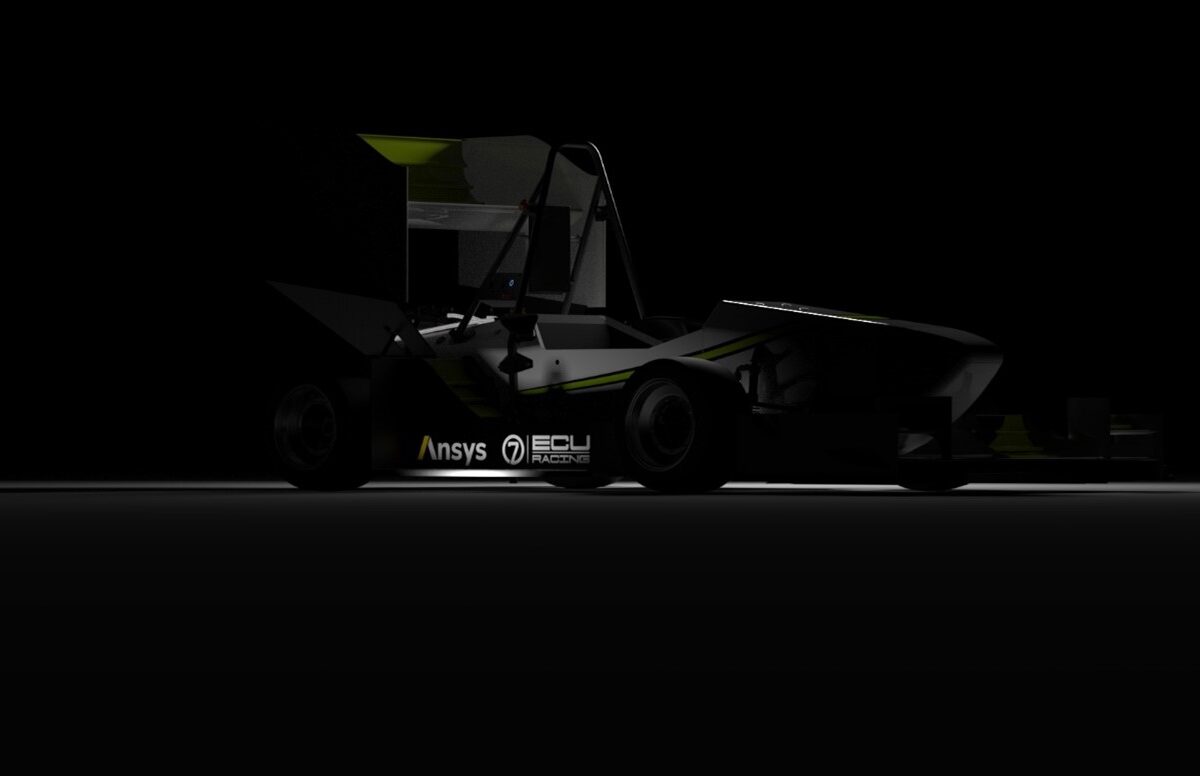
Figure 1: ECU-R 2021 Electric Vehicle (Rendered in Keyshot)
Before talking specifically about aerodynamics, a note should be made about how the team approaches design using simulation. If ECU-R had infinite monetary and human resources, then thousands of components could be designed and physically tested until the best solution was found. However, since this is not the case, time and cost-effective design methods must be utilised. Without LEAP’s support not only would the team lack the experience of industry level software, but countless components would not be optimised - a large detriment to performance.
Ansys CFD is used consistently by the aerodynamics department to evaluate concepts, perform optimisations, and create aero maps. The majority of the team’s CFD isn’t automated optimisation and thus it is the initial validation to the designer’s concept. This approach places a larger emphasis on conceptual thinking and flow field interpretation which is advantageous when dealing with limited computational power.
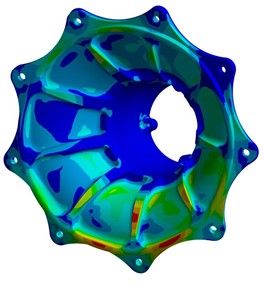
Figure 2: Wheel Hub FEA (Simulated in Ansys Mechanical)
Insights from post-processing of simulations provide the designer with the ability to identify problematic aspects of the flow such as separations, undesirable structures, and poor use of flow energy. New ideas can then be brainstormed and used in subsequent designs to better address these issues, thereby improving the overall flow around the car.
Post-processing visualisation has the large benefit of design justification without the need to manufacture parts. Therefore these ‘new ideas’ more rapidly develop allowing for more optimised geometry and greater performance.
The main goals for the EV’s new aerodynamics package were:
- Decrease condition sensitivity but increase overall downforce
- Design for simple manufacture
- Rapid design timeline with minimal CFD runs
- Don’t ask the chassis team for too much volume, they have a new powertrain to implement!
CFD is useful throughout the entire design process however, in this blog a short comparison will be made between two very different conceptual front wing geometries. You’ll notice the models lack lots of details; this is one of our many deliberate design methodologies. We believe how you design a package is more important than the package you are designing… obviously our simulations get more detailed.
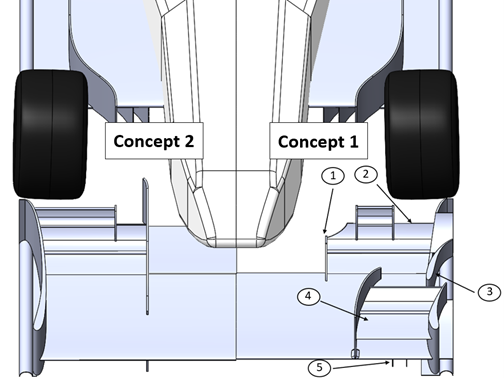
Figure 3: Conceptual Front Wing Geometries
- The flap behind the centre portion of the mainplane is removed as well as implementing a smaller ‘mid plate’. The third element is trimmed, and the gurney removed. The wing has also been raised 5mm.
- The uppermost flap has been removed in the outboard section of wing.
- The endplate has an addition of two canards and two turning vanes.
- A dual element cascade is added with an additional inboard turning vane.
- Two strakes and a footplate extension on the underside of the endplate are added.
The rest of the geometry downstream was identical, as was the CFD setup - a ‘straight-line’ simulation. The Fluent Mesher was used with 8 inflation layers and a Y+ aim of 30-80 across all surfaces including the ground plane. This typically results in a mesh count of 25 million cells. In high levels of velocity curvature, refinement regions with body sizes down to 4mm are utilised with a Poly Hex-Core mesh - capturing vortex production is key.
To avoid showing many pictures of the flow field, a few important captures with coefficient of total pressure (Cp0 or CpT) are shown in a video clip comparing both geometries. This contour is useful for displaying the total energy of the flow as it is the sum of dynamic and static pressure. It is intended that the video can be watched and paused whilst examining the notes relating to the frames and annotations.
- The adverse pressure gradient on both the cascade and the first endplate turning vane align causing the corner to separate.
- The cascades are up-washing. Due to viscosity, losses on the top of the mainplane will be created and ingested into the slot gap. This can be adjusted by moving the cascades rearwards or adjusting profiles.
- The first endplate turning vane creates a vortex co-rotating to the first canard vortex. The inboard turning vane creates a counter rotating structure.
- The mainplane losses from the cascades build, particularly outboard.
- The second endplate turning vane begins to outwash.
- The separation off the mainplane is less pronounced especially where the larger midplate was on the base case. This is partly because of the 5mm higher ground clearance and the less aggressive third element. The third element loads the front wing more and increases spanwise flow.
- The second turning vanes vortex is placed directly in the path of the very aggressive secondary canard.
- Since the updated front wing is less aggressive less ground plane loss is created.
- The secondary canard draws the first structures upwards
- The strakes in this scenario help to produce localised loading by means of sealing and vortex creation as well as a support role to the impending footplate blow-up. They are shaped to minimise loss but can be used more aggressively for squirt reduction.
- Significant less loss is produced, mainly due to again the less aggressive element.
- The footplate vortex is beginning to blow up, this occurs when the core of the vortex is decreasing in streamwise velocity. A useful contour is the streamwise component of velocity or helicity. This blow-up is common on wings very close to the ground, especially in front of a tyre due to the blockage and inherent reduction in streamwise velocity. The blow up is smaller due to the less aggressive outboard section. Feeding the vortex with more mass flow and retaining the same trailing edge position would be desired. There are multiple types of geometry to achieve this.
- Each rectangle is the same dimension, already more Cp0 will be fed into the floor.
- The losses from the vortex burst are jetted inboard, not ideal especially in more undesirable conditions such as steer and roll. Steer effects the placement of the loss and roll can affect how much front wing in-wash occurs which could be desirable for an in-wash floor.
- The midplate vortex provides some lower lateral expansion, meaning the jet isn’t pulled inboard as much.
- Higher losses are easily attracted to regions of low pressure, in this case the side wing.
- The midplate vortex has hit the side wing and blown, something which should be corrected. Noting that retaining this vortex under a variety of conditions with a more accurate model could be unlikely.
- The outboard flat floor separates less off the leading edge.
- Due to less losses inboard, a much cleaner vortex is created increasing mixing in the side wing. This can also reduce chances of burst.
- Closer to the exit of the side wing mass flow is being rotating into the floor from the vortex system off the front wing. The overall outlet also has less loss and therefore less blockage which is desirable for performance.
- The ‘ramp’ of elements in front of the wheel creates an aggressive upwash. This can promote earlier separation which creates a larger wake but less front wheel lift, a trade off to consider… what’s downstream of your tyre?
- The lack of the fourth element on Concepts 1’s front wing affects local upwash. The cascades try to recover this. It’s noted that the tyre separation is typically transient and hard to model correctly, thus its effects should be treated with caution.
- Again, the front wing allows high Cp0/Cpt to enter the floor. The contact patch wake should be treated carefully unless confident of the deformations under different conditions. More important is what this wake looks like under high steer, roll and yaw. The loss can directly affect your side wing inlet lateral size and thus downforce potential.
- The front tyre wake is managed outboard much more cleanly, thanks to the outwash created by the front wing, its true benefits seen in yaw. The side wing vertical leading edge should be adjusted due to the high lateral expansion.
- Finally, the top wake is again managed more cleanly thanks to the inboard turning vane vortex.
The purpose of this brief analysis was to show how many different flow structures can exist even on a simple FSAE car. Managing these structures throughout a range of conditions and considering manufacturability makes the process harder - without CFD, impossible!
Guest Blog compiled by Thomas Warren, 2021 ECU-R Aerodynamic Lead and 3rd year mechanical/motorsports student at ECU. Thomas has a particular passion for fluid dynamics and understanding complex flow fields across a variety of applications. He recently started his own YouTube channel which explores CFD and applications of Fluid Dynamics.